Nginx, Modsecurity and ELK stack
It has been a while since i have written here and lately i was kinda struggling to import and have meaningful modsecurity data in ELK.
Long story short the easiest way is to convince Modsecurity to write the data in json format. In this way all the “parsing” and importing becomes more easier. Otherwise regexp and grok might be your friend.
But step by step.
1. Let compile Modsecurity , Nginx module and do the necessaries.
cd /opt && sudo git clone https://github.com/owasp-modsecurity/ModSecurity.git

cd ModSecurity

sudo git submodule init

sudo git submodule update

sudo ./build.sh

sudo ./configure
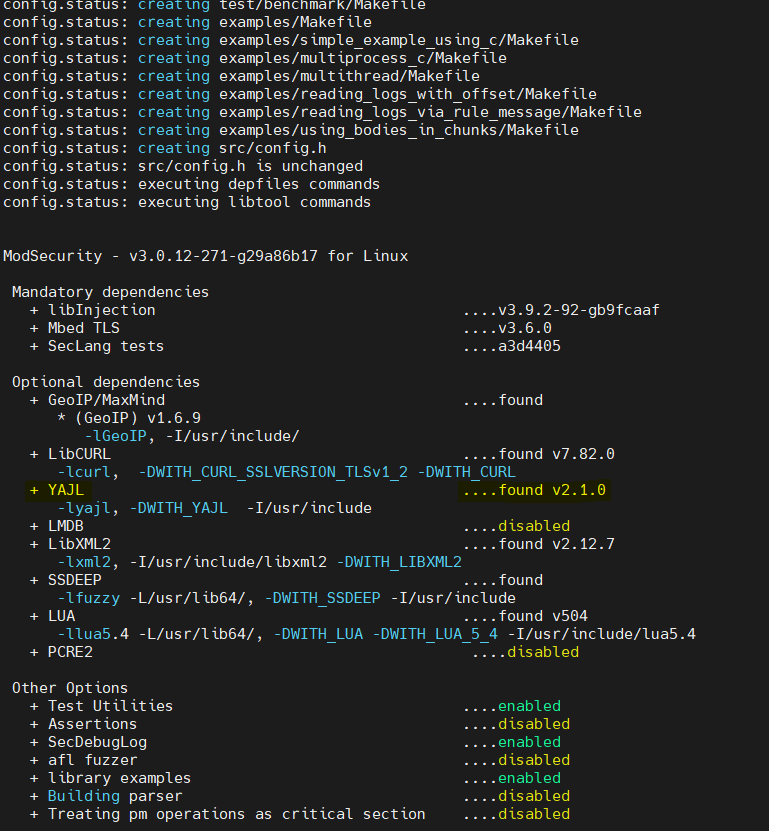
The most important thing is to have lib-yajl installed otherwise logs cannot be created in json format.

sudo make

sudo make install
2. Download Modsecurity-nginx Connector
cd /opt && sudo git clone https://github.com/owasp-modsecurity/ModSecurity-nginx.git
3. Check Nginx version , download nginx and compile the mod-security module.
nginx -v

nginx version: nginx/1.26.2
cd /opt && sudo wget http://nginx.org/download/nginx-1.26.2.tar.gz

sudo tar -xzvf nginx-1.26.2.tar.gz

cd nginx-1.26.2

sudo ./configure --with-compat --add-dynamic-module=/opt/ModSecurity-nginx
sudo make

sudo make modules
Let’s copy the modules and the configurations
sudo mkdir -p /etc/nginx/modules-enabled/

sudo cp objs/ngx_http_modsecurity_module.so /etc/nginx/modules-enabled/

sudo cp /opt/ModSecurity/modsecurity.conf-recommended /etc/nginx/modsecurity.conf

sudo cp /opt/ModSecurity/unicode.mapping /etc/nginx/unicode.mapping
Add some configuration in Nginx and the vhost that you want to monitor.
nano /etc/nginx/nginx.conf

Add the fallowing line:

load_module /etc/nginx/modules-enabled/ngx_http_modsecurity_module.so;
In the desired vhost add:
server {

........

modsecurity on;

modsecurity_rules_file /etc/nginx/modsecurity.conf;

}
For the moment we will leave the SecRuleEngine DetectionOnly from /etc/nginx/modsecurity.conf as is.
Basically this will only logging and not rejecting once problem is found and we want this due to many false positive that we will have in the beginning. We’ll talk later(or in a different chapter is this become too long) about this subject.
4. Install core rule set (CRS)
There are two versions which can be installed when i am writing this article: 3.3.7 or 4.8.0 . Up to you which flavor.
cd /etc/nginx/

sudo wget https://github.com/coreruleset/coreruleset/archive/refs/tags/v4.8.0.zip

sudo wget https://github.com/coreruleset/coreruleset/archive/refs/tags/v3.3.7.zip

sudo unzip v3.3.7.zip

sudo mv coreruleset-3.3.7 owasp-crs

mv owasp-crs/crs-setup.conf.example owasp-crs/crs-setup.conf
Add CRS to modsecurity
sudo nano /etc/nginx/modsecurity.conf

Include owasp-crs/crs-setup.conf

Include owasp-crs/rules/*.conf
Almost done. Now we should modify the modsecurity.conf file to have logs in json format.
Add the fallowing(preferably in # — Audit log configuration section ). In this section comment the present settings related to the same topic.
SecAuditEngine On

SecAuditLogParts ABDEFHIJZ

SecAuditLogType Serial

SecAuditLog /var/log/modsec_audit.json

SecAuditLogFormat JSON

SecAuditEngine RelevantOnly

SecAuditLogRelevantStatus "^(?:5|4(?!04))"
Check nginx configuration: nginx -t and restart the daemon.
If all the settings have been done correctly, you should already see logs coming in.
tail -f /var/log/modsec_audit.json | jq
5. Sending data to elastic search.
There are many ways to do it. Deploying a fleet of Elastic Agents or if not possible using filebeat.
Elastic agent are very powerful but if you have exotic Linux SO you are forced to running those in a dockerized environment and if you have restrictions regarding docker&co than filebeat is your friend.
a. Install filebeat from repo ( most of the Linux OS has it included). I will not insist in this step.
b. Configure filebeat in this way:
On /etc/filebeat/filebeat.yml on the filebeat.inputs: add the fallowing:
- type: log

enabled: true

paths:

- /var/log/modsec_audit.json

json.keys_under_root: true

encoding: utf-8

document_type: mod_security

close_eof: true

scan_frequency: 5s

clean_*: true
In the same file on Elasticsearch Output section add the fallowing:
output.elasticsearch:

# Array of hosts to connect to.

hosts: ["your_ip:9200"]
# Protocol - either `http` (default) or `https`.

protocol: "https"
# Authentication credentials - either API key or username/password.

#api_key: "id:api_key"

username: "elastic"

password: "your_password"
And restart filebeat
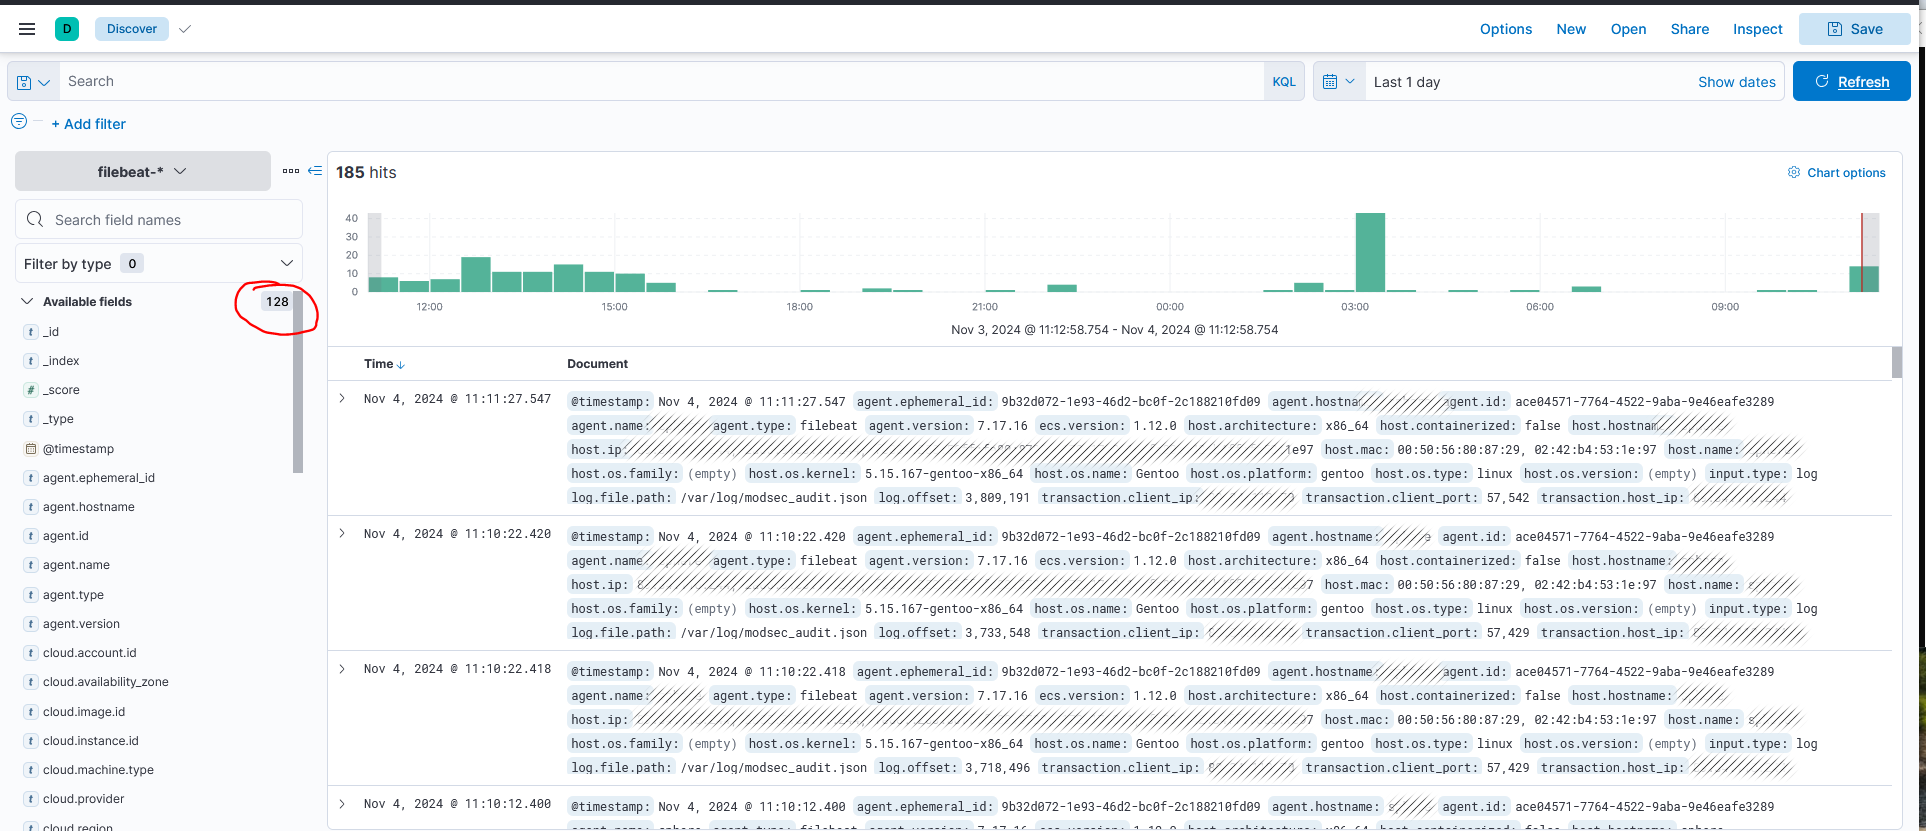
Logs should start to become visible in elasticsearch and as you can see above we have 128 fields for which we can do log manipulation and create proper dashboards.
